SalesPad Quick Reports are one of my favorite features with SalesPad, they can be created to any information that resides in your SQL database.
The true power to analyzing your business can come from a BI SalesPad Pivot Grid Quick Report. This report and have default columns, rows, filters and data areas, but can then drag and drop any data on the report to slice the information into ways that provide you with the information you need to drive your business.
The power of Pivot Quick Reports is – if the data is in your database then it can be used to analyze your business. Data from any module can be presented – it is not limited to just the sales or purchasing data.
Example #1:
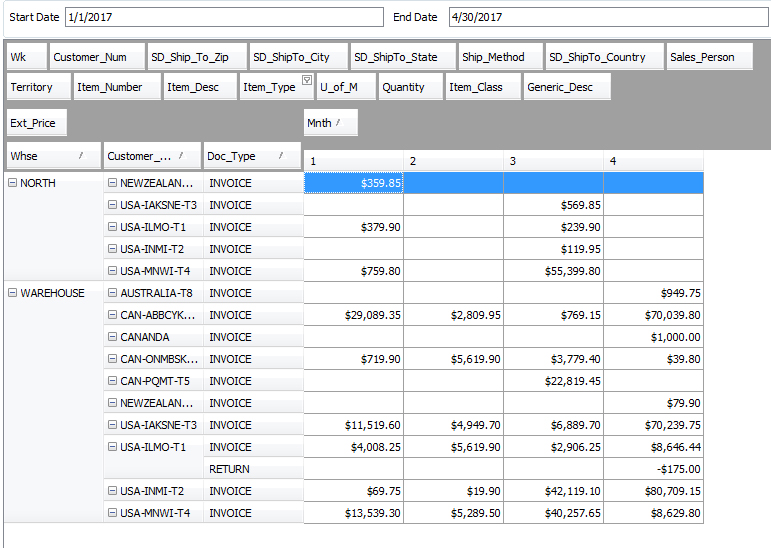
This Quick Report is designed to show sales by Whse/Site, Customer Class, with Invoices and Returns separately.

Example #2:
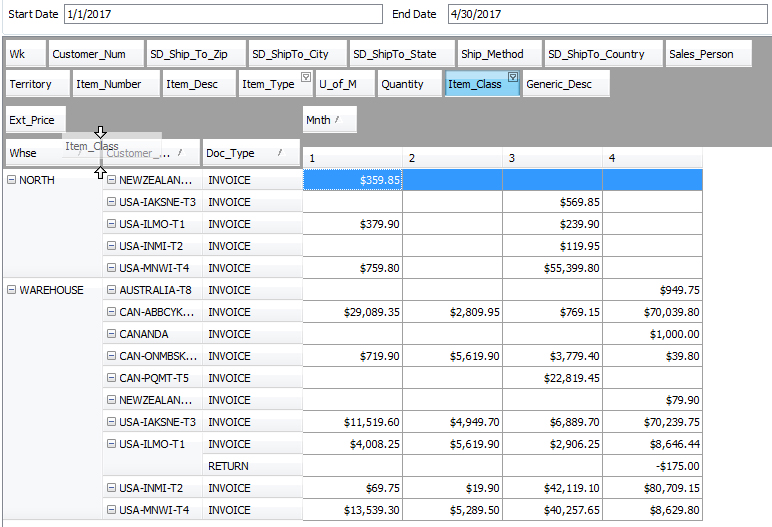
The same Quick Report is can have the data rearranged to show sales by Whse/Site, Item Class with Invoices and Returns separately by dragging the Item Class from the filter area down to the row area and drag off the Customer Class.

Example #3:
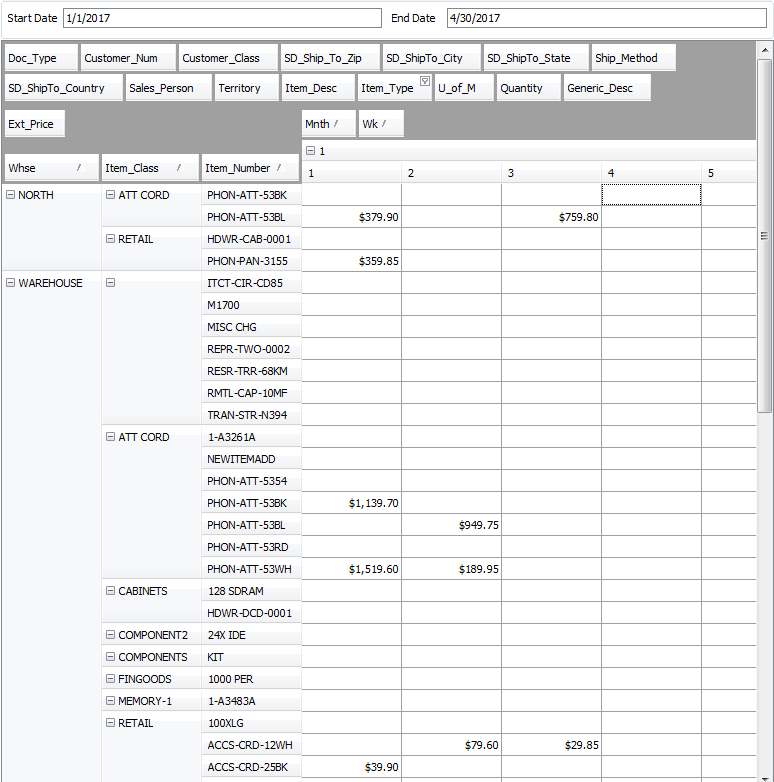
The same Quick Report is can have the data rearranged to show sales by Whse/Site, Item Class, and Item with net sales by month/week in columns.

FAQ’s
I am trying to print a customer list with customer number,name, address etc and there is no option to export it or print. Any idea how to go this?
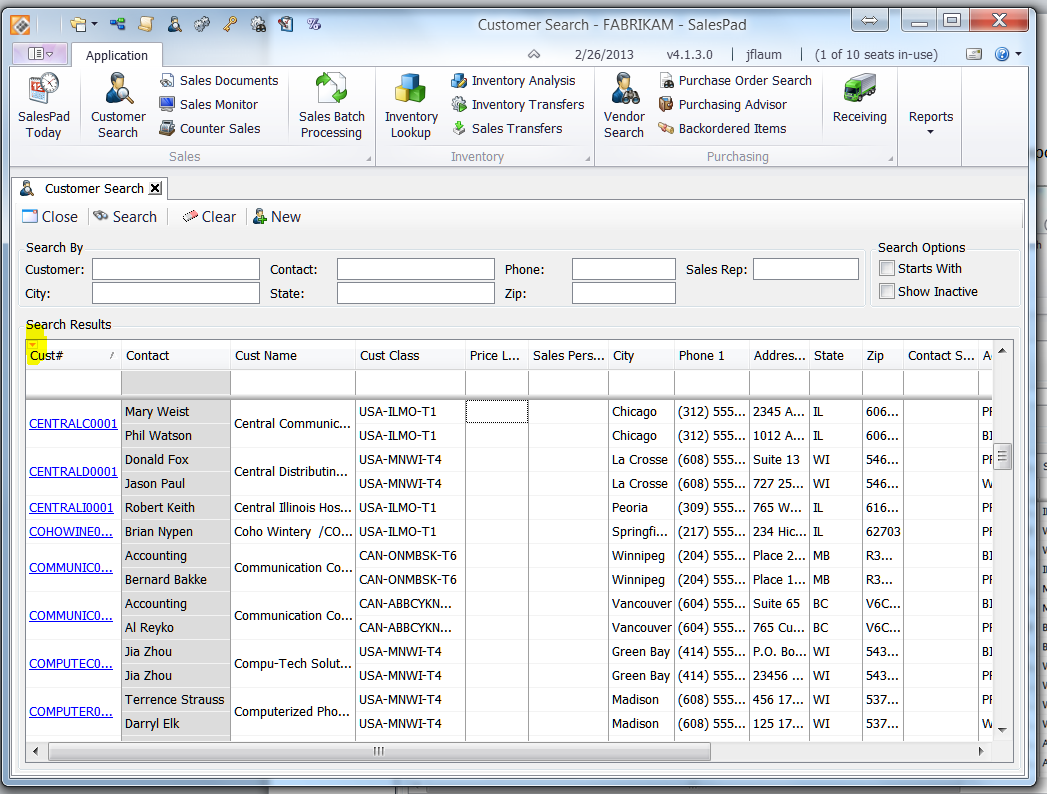
That can be done from the customer search screen. If you click on the little red arrow highlighted below you will have the option to export the data to Excel.

By John DiLeo, CAL Business Solutions, Leading Microsoft Dynamics GP + SalesPad Partner


I am trying to print a customer list with customer number/name/address etc and there is no option to export it or print. Any idea how to go this?
Lorraine…we added your question with an answer to the bottom of the post. We hope you find this helpful.