Almost every SalesPad screen displays data in a grid. You can easily change the grid to suit your needs and also use it as a reporting tool. Here are some things you can do:
-
- Click on a column to sort by that column
- Click and drag a column header down off the header bar to remove the column from the grid
- Click and drag a column header to another position to re-order the columns
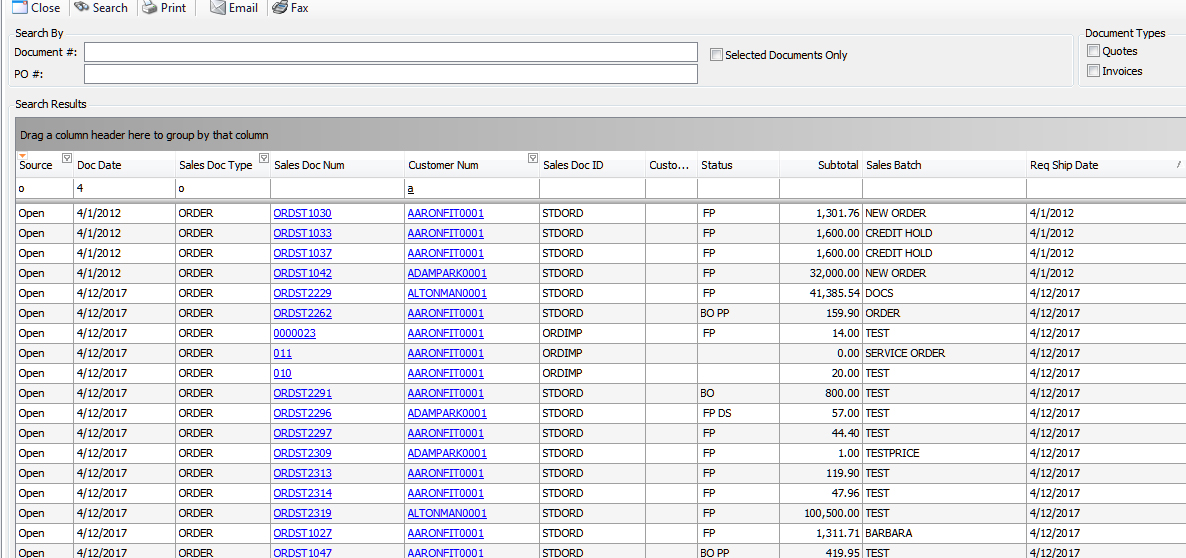
- Use an auto-filter row. In the example, I’ve selected only open orders dated April, for customer numbers starting with ‘A’, and sorted it by required ship date.

-
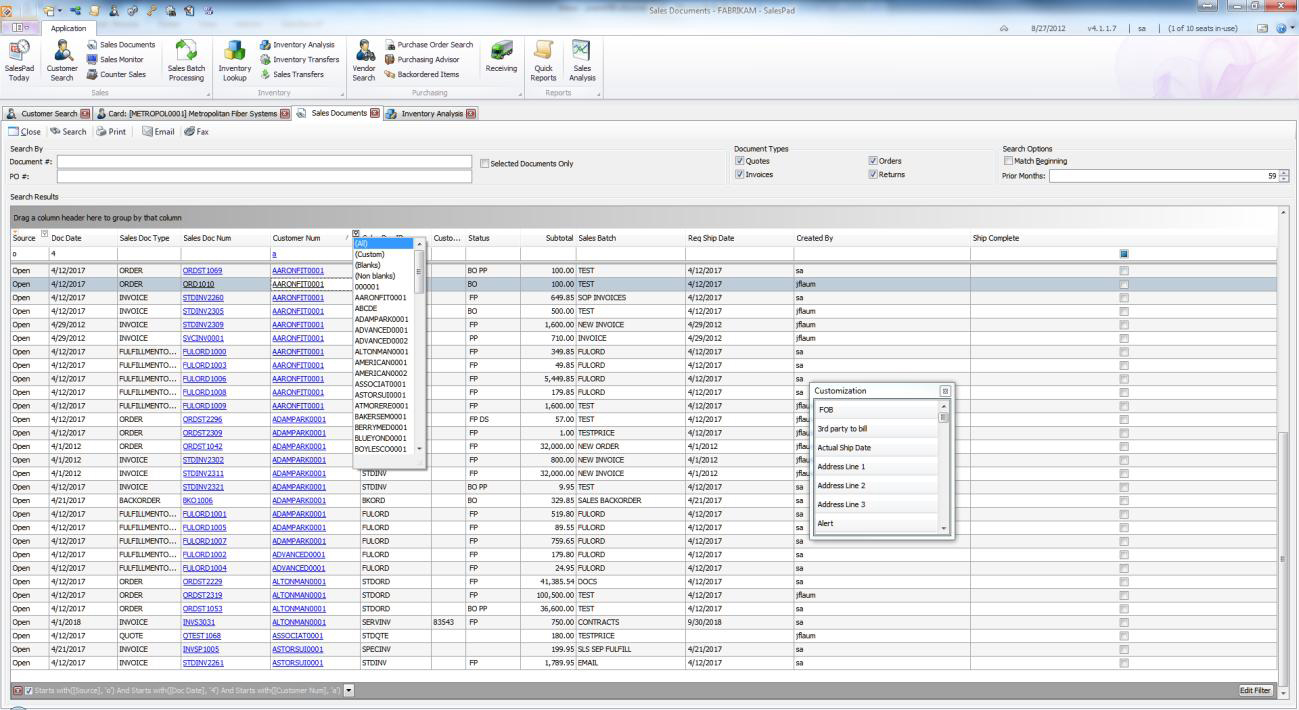
- Right-click on the column header and select “Column Chooser” to add columns to the grid
- Click on the small funnel filter on the top right of a column header to bring up a list of unique values to choose/filter from for most columns:
![]()

-
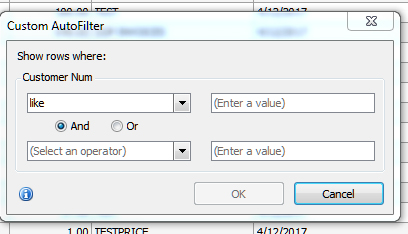
- Or create your own custom filter by clicking on “Custom” in the funnel filter – for more complex selection criteria

- Use the global find feature on any grid by pressing <ctrl>F to bring up find box, as you enter your search criteria the matching found records will be highlighted in yellow.
- Click on the red triangle on the header of the leftmost column to print the grid or
- Export the records in the search grid to Excel.
By Jo Ann Flaum, CAL Business Solutions, Leading Microsoft Dynamics GP + SalesPad Partner


