Finance professionals love Excel charts, especially fancy pivot charts and tables. But there is nothing worse than an Excel chart that is out of date. In this video, Amber Bell, Dynamics GP training expert for CAL Business Solutions will show you how set up a pivot table using the Dynamics GP Live Excel Feed feature. When you make changes in Dynamics GP you will automatically see those changes reflected in your live Excel pivot table or chart. So you data is never out of date. What is better than Microsoft Excel? Excel connected to Dynamics GP.
Trouble viewing? Watch video: http://youtu.be/watch?v=sIaeu_ivwyc
Transcription:
This is Amber Bell from CAL Business Solutions. Today we are going to talking about setting up a pivot table using the Dynamics GP Live Excel feed. If you haven’t implemented the Live Excel (feature) you can go under administration, there is reporting tools setup. Have someone who is an administrator for your company, or even your partner, set up where the reports will be stored and go ahead and deploy them. You want to be sure that where you deploy them will have security because this does pull information directly from your accounting or Dynamics GP table, so there will be information about financial information and customer information. So be sure that it’s set up somewhere secure.
I’m using the sample company so mine is set up on just my local drive. Mostly likely for yours it will be on a GP shared drive and you would make sure that that location is secure. So we’re going to ahead and pretend this has already been deployed, because it has been, and I’m going to go ahead and open up Excel. Now I have this set up as a shortcut for my system to where I have the Live Excel and I earlier set up a report. What I did was I opened up the one that was my company I.D. and then it said customers. So what I did was I went from the data connections and then I pulled, under sales, the one that said customers and that one, the customer list. There’s a lot of information I don’t need. You’ll see it goes really, really far. So what I did on mine is I went ahead and I just dumped the columns that I didn’t need and then saved it as a report.
So if I go into my report you’ll see under my company under sales I have CAL Tips and this is customer balanced by salesperson. Now I’ve gone ahead and I’ve dumped the columns that I don’t need and we’re going to go ahead and refresh this data, so refresh, and if I scroll over you will see I don’t have as many columns. I kind of end over here, and I realize I don’t need this send statements. I’m going to go ahead and delete this, and now I have my salesperson, my territory, my class. I have all my customer information.
So what I’m going to do is very quickly insert a pivot table. Actually we’re going to do a pivot chart. So to do that you need to be using Excel Version 2007 or above, so I’m using 2010. We’re going to click insert and we’re going to hit pivot table and then I’m going to use the dropdown and go to pivot chart. If I have my selection on A1 it’s going to go ahead and automatically select the table and we’re going to click okay, and I get this popup. So what we’re going to do is I want to have it filtered and we’re going to say I want to filter it by salesperson I.D. And what we’re going to do is we’re going to go ahead and we’re going to say I want the customer name, and then what I want to do is I want to go ahead and put the balance. So I want to see this. We’re going to go ahead and change this chart. We’re going to say I would rather see this as a pie chart. I’m going to click okay, and what I can also do is say I want to do this by customer class and put this in here.
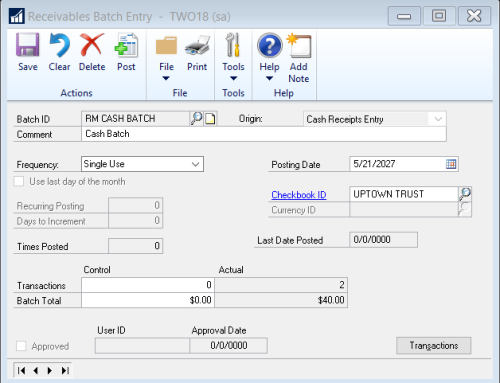
So now I can see here’s my customer class and I can see my highest customers. There’s some customers that don’t have a class, but I can say, well, I want to take a look at a couple of people. So we’re going to select multiple and we’re going to say this plus Francine and Sandra, and click under that, and now I can see that the highest class we have is this class here. What’s nice about this is I can actually double click right here and we want to see the customer name and now I can see under this class which customers are the highest number. What’s nice about this is now I can go into (Dynamics) GP and we’re going to go ahead and do a real quick transaction for Breakthrough Telemarketing. So we’re going to go into GP and we’re going to do a cash receipt and I’m going to say Breakthrough Telemarketing, and we’re going to say that they paid $10,000.00 and we’re going to apply this and click okay. And now we’re going to go ahead and do a batch real quick and post. And then we’ll go back over to Excel once that finishes, and right now we have Breakthrough Telemarketing at $13,000. We can go into data and refresh, and we’ll refresh this as well. So we’ll go here and refresh, and then we’ll go over here and we’ll see now Breakthrough Telemarketing has a much lower balance and I’d be able to go ahead and filter and kind of see what’s going on in the system. So setting up a pivot table, you can pull the information in through filters and then see what’s going on in your system and it will be updated automatically from Microsoft Dynamics GP.
For more great Dynamics GP tips and tricks visit www.calzone.com/tips and sign up for our monthly eNewsletter.
For more Dynamics GP Tips and Tricks visit our Youtube channel www.youtube.com/user/calszone, read our Dynamics GP Tips and Tricks blog www.calszone.com/tips or sign up for our e-newsletter www.calszone.com/user-news.
By CAL Business Solutions, Connecticut Dynamics GP Partner www.calszone.com

